Apparently, there are two types of motorcycle owner.
People who buy a motorcycle and ride it.
And people who buy a motorcycle, ride it, then start wondering what would happen if they changed just one more thing.
I think we’ve established which category I belong to.
The Low Rider already has the ape hangers, the Willie G accessories and the complete YSS suspension setup. Robyn has discovered she likes being on the back, and I’ve discovered that owning a Harley generates a surprisingly consistent supply of things to write about. And spend money on.
So this week, I installed a Dynojet Power Vision 4.
Because apparently the next logical step after sorting out how the motorcycle goes around corners is plugging a computer into it.
MOAR POWER.
Argh, argh, argh!
Please imagine the appropriate completely unnecessary grunting.
The Harley now talks to my phone
The Power Vision 4 is a flash tuner. A little piece of hardware plugs into the motorcycle’s diagnostic connector, communicates with the Power Vision phone app over Bluetooth, and lets you load a tune into the bike’s existing engine control unit. You don’t have to remove the ECU and send it away somewhere.
It also provides access to Dynojet’s tune library, records engine data, reads and clears diagnostic trouble codes, and backs up the original factory tune so there’s a route back to stock.
Which is reassuring.
I quite like having a way back before pressing buttons that change how expensive machinery works.
But the bit that really caught my attention was AutoTune.
Because a device that combines motorcycles, software and unnecessarily detailed tables was never going to remain outside my garage for very long.
Some people accessorise their Harley with leather tassels.
Apparently I’ve chosen data acquisition.
AutoTune, not auto-magic
I’m using AutoTune Basic, which works with the bike’s existing narrowband oxygen sensors. It collects riding data and uses that information to suggest adjustments to the volumetric efficiency tables, usually shortened to VE tables. Those tables describe the engine’s estimated airflow, which the ECU uses when working out fuel delivery.
In other words, we’re trying to make the computer’s understanding of the engine agree more closely with what the engine is actually doing.
Preferably without relying on:
“Yeah mate, that sounds about right.”
The important distinction is that AutoTune Basic isn’t continually rewriting those tables while I ride. It gathers information, then the corrections are reviewed and applied afterwards. The updated tune gets flashed into the ECU, and another ride can check how things have changed.
So the process involves riding the motorcycle, looking at the results, making a change, then riding the motorcycle again.
Finally.
A software testing process I can get behind.
Ride one: apparently we have spreadsheets now
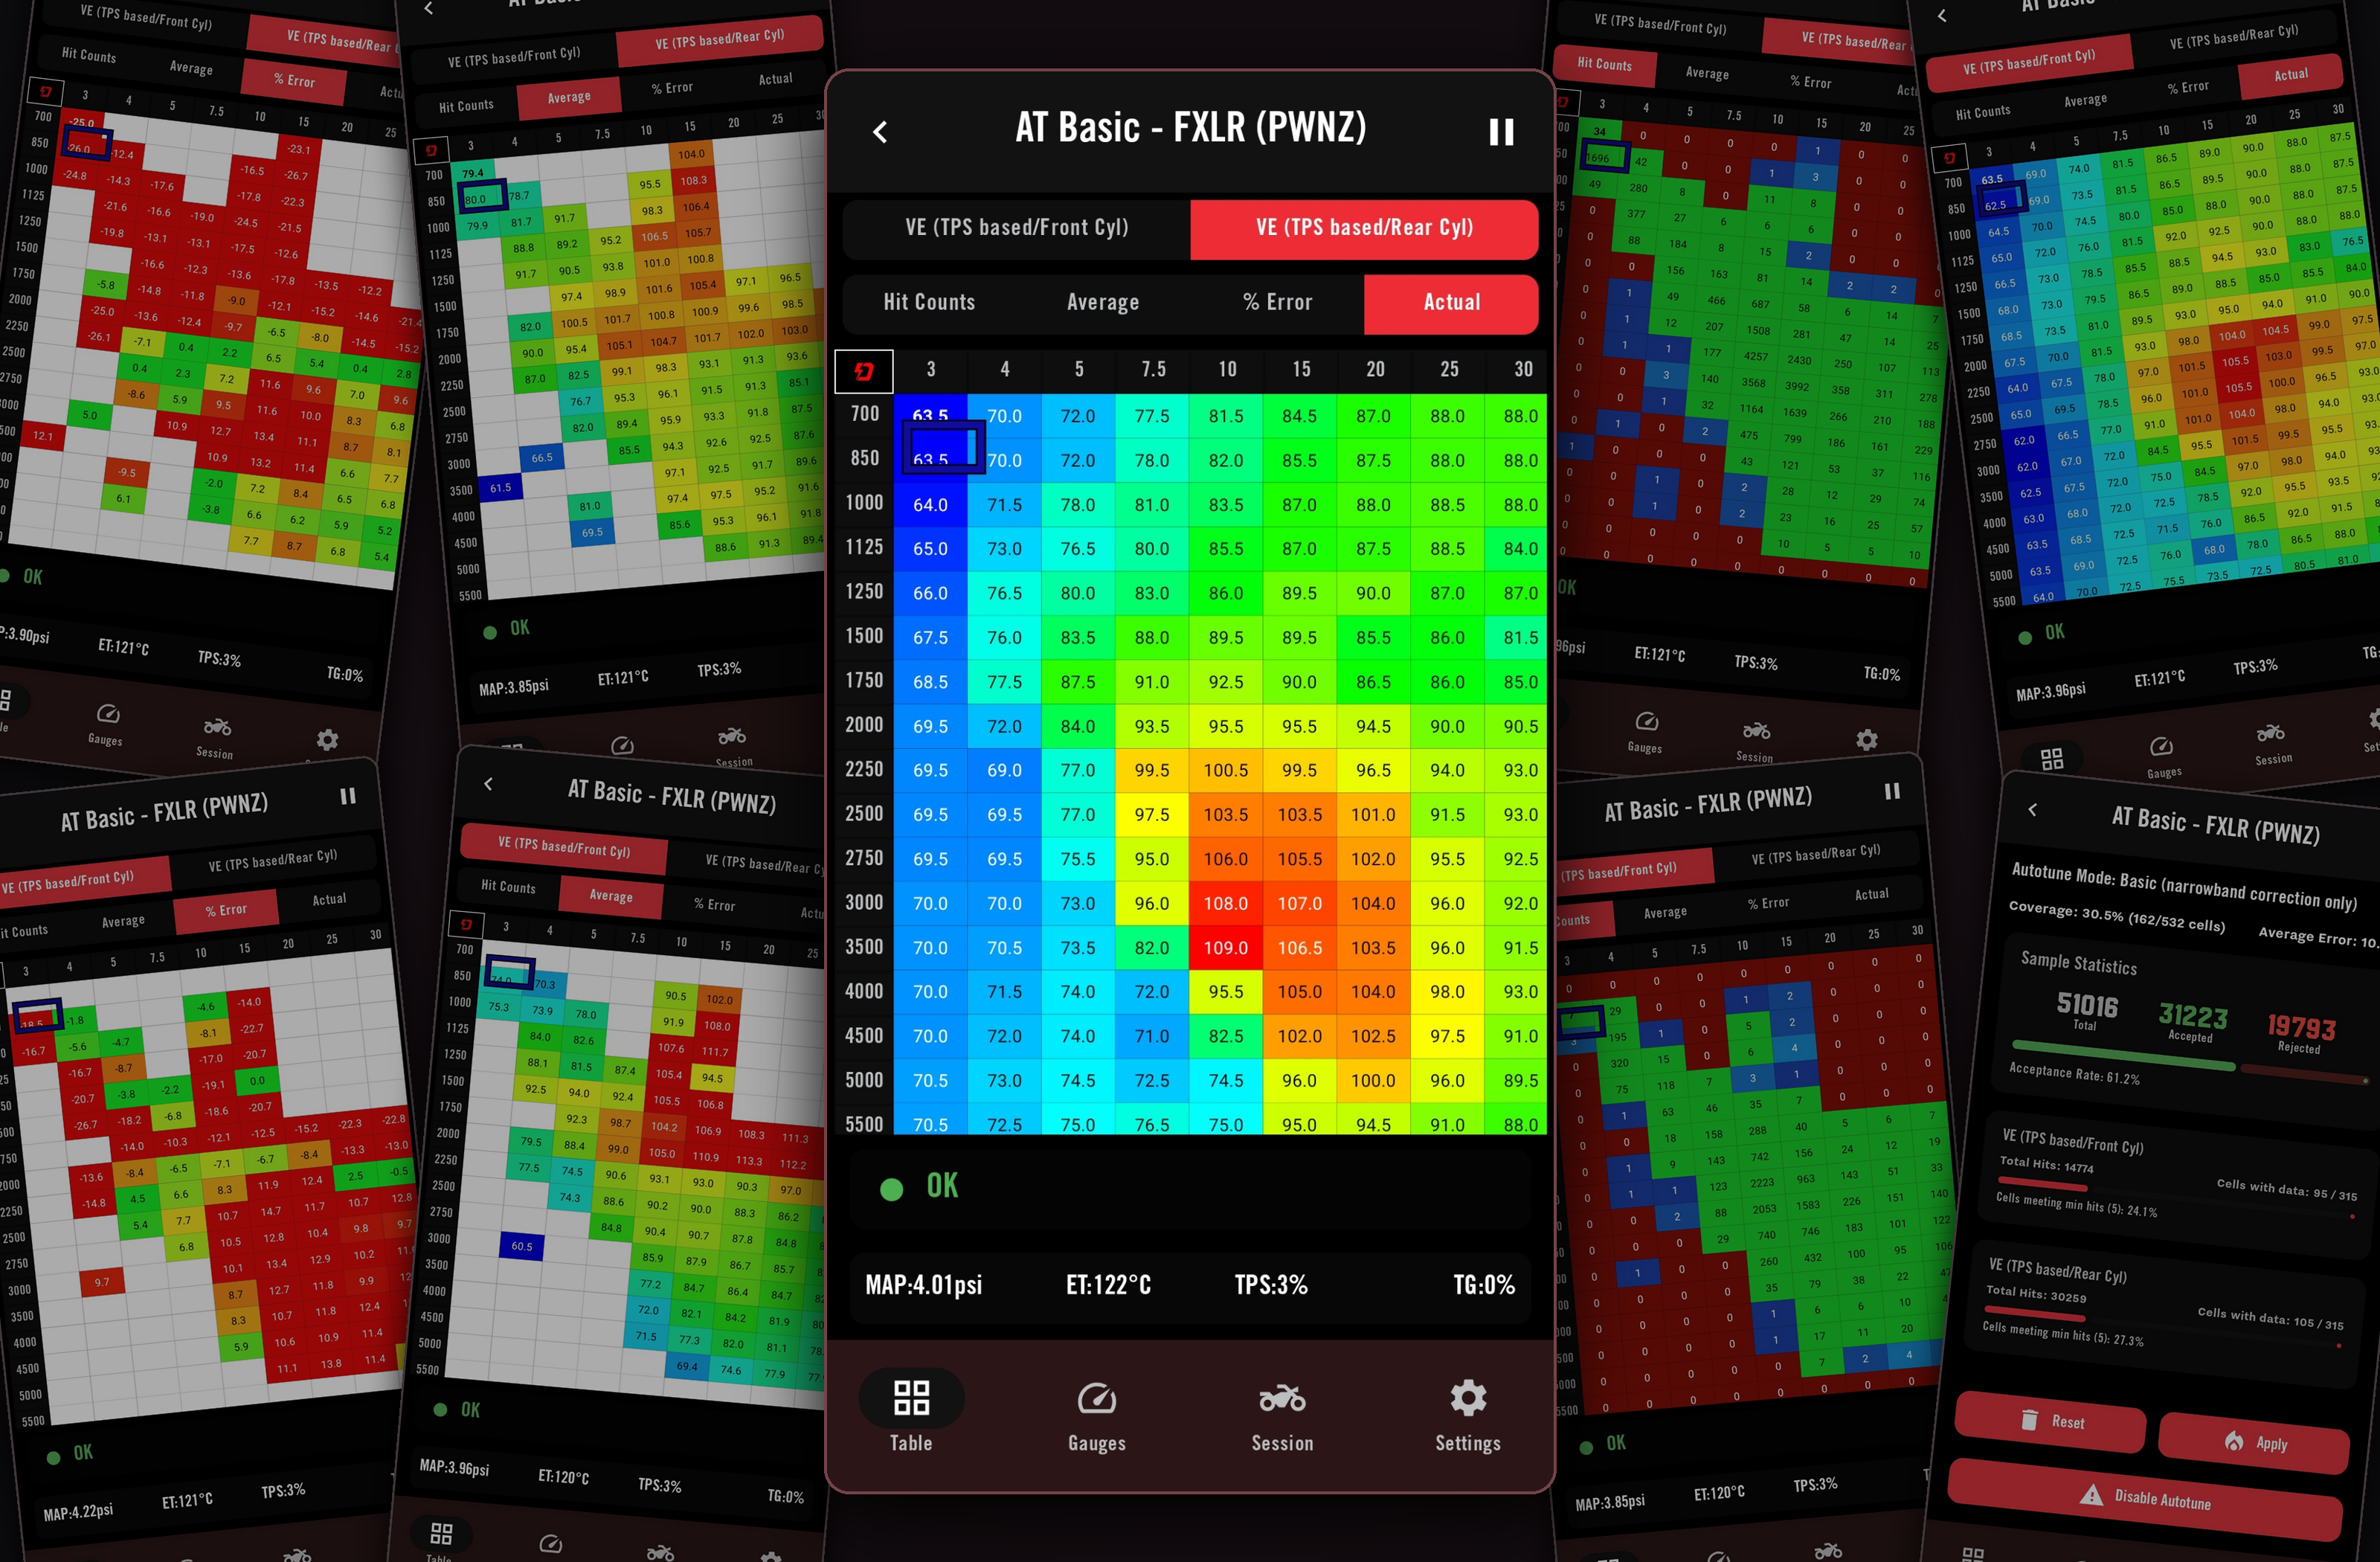
The first test ride produced this:
I went out on a Harley and came back with something that looks like an argument between Excel and a Christmas tree.
There’s quite a lot happening in those screenshots.
The tables separate the front and rear cylinders, with different engine speeds and throttle positions represented by individual cells. The hit-count screens show where data was collected; the error screens show where the current and learned values disagree. They’re answering different questions, despite sharing the same enthusiastic approach to colour.
The first session recorded 51,016 samples, of which 31,223 were accepted. The app reported 30.5% coverage, covering 162 of 532 cells, and an average error of 10.9%.
Now, thirty percent initially sounds a bit like I’ve handed in unfinished homework.
But filling every box isn’t the point.
I’m interested in the areas the motorcycle actually uses, not winning an imaginary prize for visiting every possible combination of revs and throttle.
And the first ride had collected a particularly healthy amount of information around 2,000–3,000 rpm at modest throttle openings. Some of those cells had thousands of hits. There were also consistent discrepancies through parts of the 2,500–3,500 rpm midrange, often around 10–15%, with broadly similar patterns in both cylinders.
That was the useful part.
Not one dramatic-looking square.
A repeated pattern in an area where the bike was spending plenty of time.
The data was effectively introducing me to my own riding habits.
“Hello Paul. You seem to spend quite a lot of time here.”
Yes.
That’ll be the bit where the Harley makes its lovely noise and I decide there’s absolutely no urgent reason to get off it.
Apply the correction. Keep the learning.
At the end of the first ride, I applied the AutoTune result to the bike.
Which immediately raised a very reasonable question:
Had I just finished the process, or could the next ride build on what we’d already learned?
It could build on it.
The corrected tune became the starting point for the next session. I wasn’t throwing away the first ride and returning to the original calibration; I was checking the next version against another set of real-world data. That’s the iterative process Dynojet describes.
Excellent.
The motorcycle now has software revisions.
This was probably inevitable.
After going through the screenshots with ChatGPT, the idea for ride two was to broaden the coverage rather than simply collecting another mountain of samples in the same comfortable cruising patch.
Apparently the homework was:
Go riding again, but use a few different parts of the engine.
I felt reasonably well qualified for this assignment.
Ride two: make the engine do something different
On the second ride, I deliberately spent more time at the lower end of the rev range and above 3,500 rpm, rather than automatically settling into the same cruising rhythm.
The point wasn’t to turn every outing into a maximum-attack performance test.
It was to gather information from areas that had received less attention the first time around.
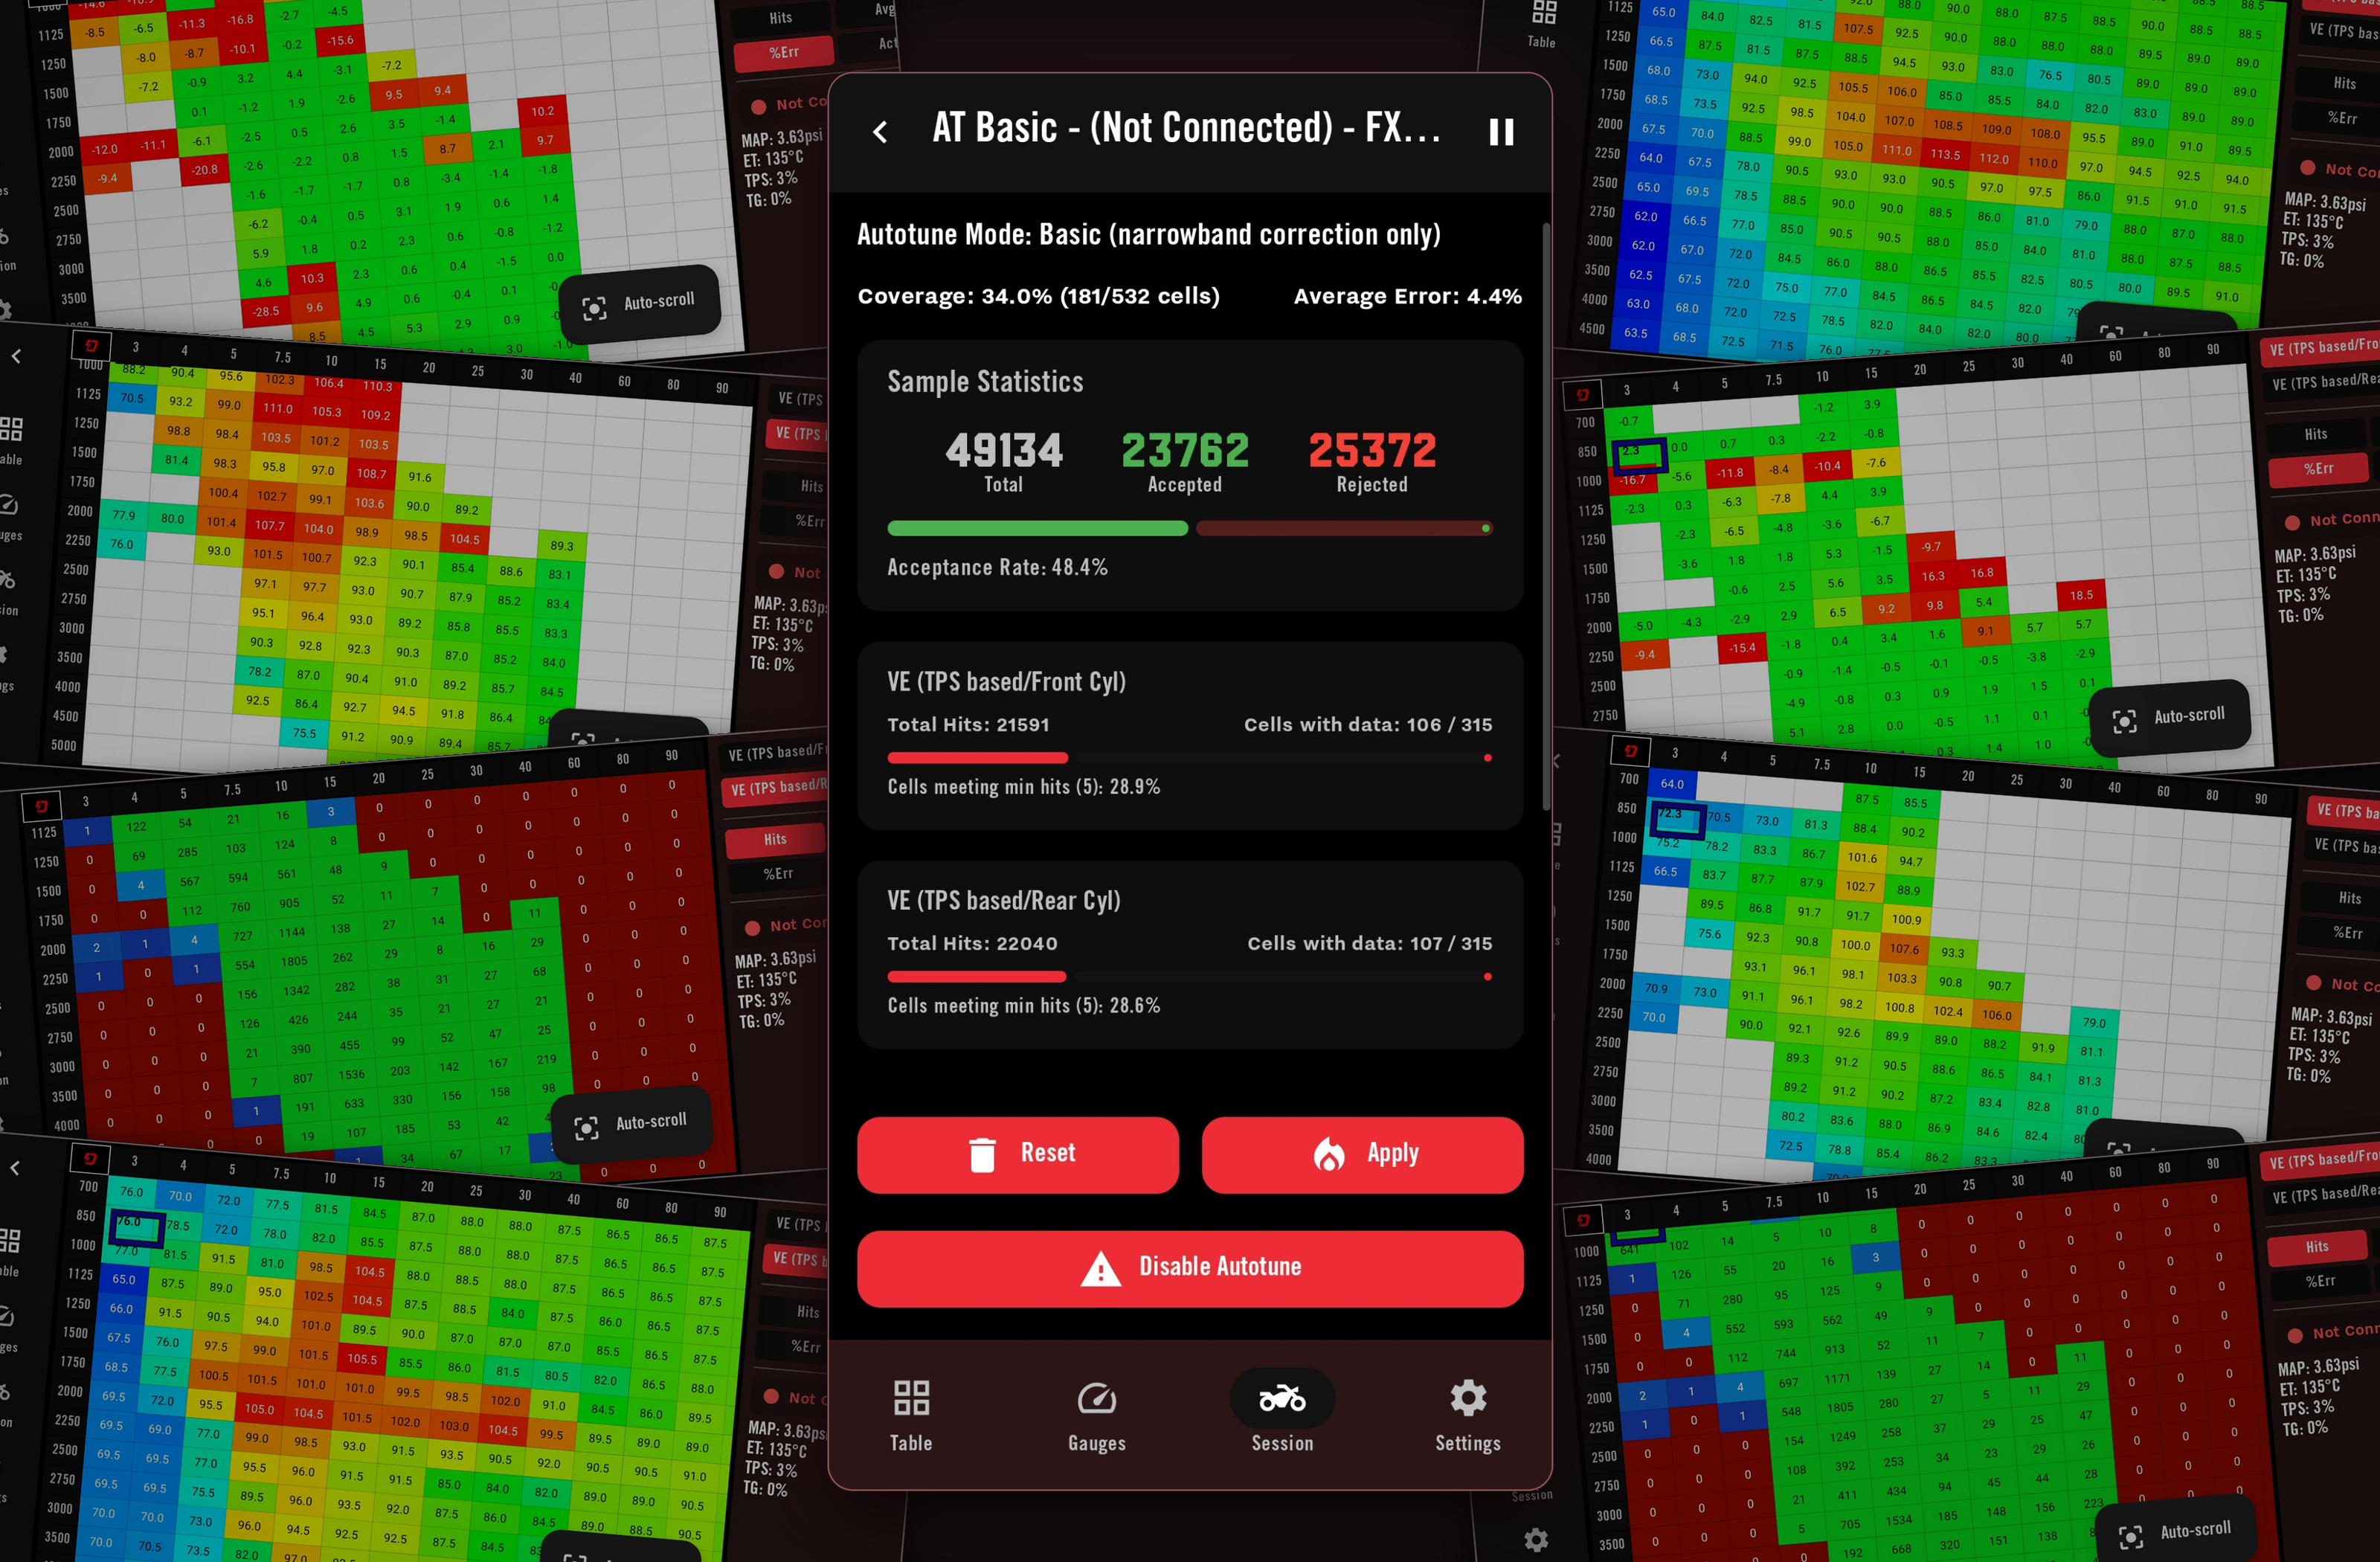
The second set of screenshots looked like this:
The Harley has submitted its second assignment. This one has considerably better numbers.
Here’s what the two session summaries reported:
PV4 session result
Ride one
Ride two
Total samples
51,016
49,134
Accepted samples
31,223
23,762
Reported coverage
30.5%
34.0%
Covered cells
162 / 532
181 / 532
Average error
10.9%
4.4%
That last line deserves a moment.
10.9% down to 4.4%.
That’s roughly a 60% reduction in the app’s reported average error.
Now we’re getting somewhere.
There were fewer accepted samples overall, but broader coverage. More importantly, many of the well-sampled midrange cells that had shown double-digit discrepancies on the first ride were now much closer. The second run also added useful information through the lower-rpm area and around 3,500–4,500 rpm.
They were different rides, so this isn’t a perfectly controlled laboratory comparison.
But seeing the previously troublesome, heavily sampled areas settle down is a much more convincing sign of progress than simply watching the total sample counter get bigger.
The exciting part wasn’t that I’d collected another enormous pile of numbers.
It was that the numbers were starting to agree.
Yes.
I am now getting excited about agreement between tables.
Please remember that I’m doing this while owning a motorcycle with ape hangers. I’d like to retain at least a small amount of credibility.
But where’s the “moar power”?
This is the bit where I’m supposed to announce that I’ve gained thirty horsepower, frightened several sports bikes and altered the rotation of the Earth.
Unfortunately, those screenshots aren’t a dyno chart.
A sixty-percent reduction in reported tuning error does not mean sixty percent more power.
And a 4.4% average doesn’t mean the entire engine calibration is now perfect.
What the results show is encouraging progress in the areas sampled: after the first correction, the next session generally needed smaller adjustments in important parts of the riding range.
That might not make quite such a dramatic headline.
But it’s rather more useful than inventing horsepower.
There are limits to the process, too. Basic uses narrowband sensors, which have a restricted useful measurement range. Dynojet distinguishes that from wideband tuning, particularly when dealing with high-load, high-rpm operation. This isn’t a replacement for properly measured, full-throttle development work.
So I’m not declaring victory over every part of the fuel map.
I’m getting the fuelling better matched to the engine in the areas I’ve actually measured.
Which brings this suspiciously close to the suspension story.
The interesting part isn’t simply buying something with an impressive name.
It’s getting the setup right.
Although Power Vision does sound considerably more exciting than:
“A sensible attempt to reduce discrepancies in estimated cylinder airflow.”
I can see why they didn’t print that on the box.
The next test involves being normal
The next step is to review and apply the second set of corrections, then see how the result holds up during an ordinary ride.
Not another expedition dedicated to filling empty squares.
Just using the motorcycle normally and checking whether the well-used areas stay reasonably close. That was the proposed validation run after reviewing ride two.
Which sounds excellent.
Because the purpose of all this isn’t to turn the Low Rider into a mobile spreadsheet.
The spreadsheet is supposed to help the Low Rider.
There is a difference.
A difference I should probably remind myself of occasionally.
I still want to look through a corner, roll the throttle on and enjoy that big Milwaukee-Eight doing its thing.
THUMP. THUMP. THUMP.
I’d just like the computer to be properly briefed about the proceedings.
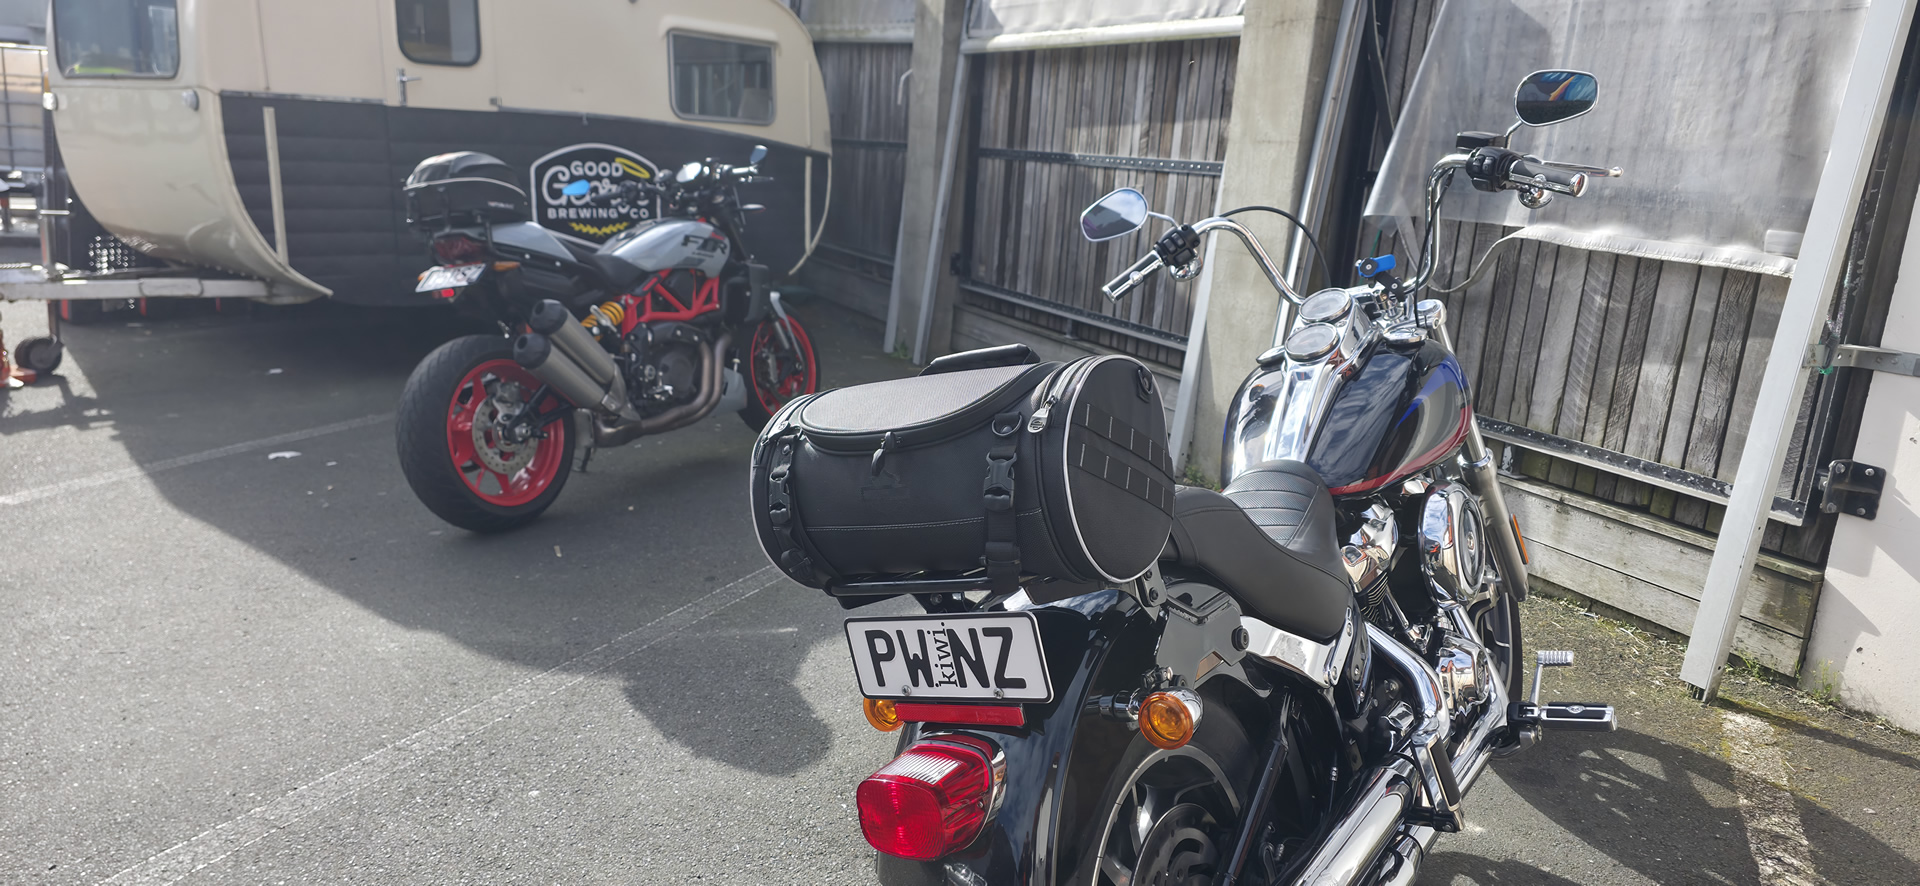
We should really stop for a beer at Good George to discuss things
Let's read the chat log
ChatGPTSaved conversationPower Vision 4 tuningOkay, so, the goal is to warm the bike up first. Then find a mix of quiet roads where you can do steady throttle cruising and some gentle roll-ons. Think smooth and gradual, not WOT blasts. Use lower gears to get higher rev cells without silly speeds. Dynojet says to hit a variet…Read conversation ↗14 messages · 15 min read
You
have a Power Vision 4 plugged into my Harley Davidson Low Rider, Milwaukee 107
I want to do an auto-tune
how should I ride the bike while I'm doing an auto-tune
ChatGPT
Okay, so, the goal is to warm the bike up first. Then find a mix of quiet roads where you can do steady throttle cruising and some gentle roll-ons. Think smooth and gradual, not WOT blasts. Use lower gears to get higher rev cells without silly speeds. Dynojet says to hit a variety of RPM, throttle, and load conditions. So, aim for about 20 to 30 minutes of riding with all those variations.
You
Should I be doing be doing city riding as well
ChatGPT
Yeah, if that's part of your normal riding, then definitely do some of that too, but just keep it smooth and steady, not darting around like in traffic.
You
Should I warm my motorcycle up before I start the Power Vision 4 auto-tune or should I start it from cold
ChatGPT
Alright, so warm it up first— or rather, don't start doing your auto-tune riding until the engine is fully warmed up. The default minimum temp is around 180 degrees Fahrenheit or 82 degrees Celsius. Until you're at that temperature, it won't learn anyway. So start it up, ride gently for the first5 to 10 minutes. Don't just idle in the driveway. And once you're up around that temp, then begin your auto-tune riding. And if you do want a really specific 30 to 45-minute routine for your 107, let me know. I can lay out gears and RPM targets.
You
I've been for a ride, and run an auto tune. I'm going to upload screenshots. Tell me what you think once you have studied them
ChatGPT
I’ve gone through all nine screenshots carefully. There’s actually quite a lot we can tell from this first run.

**Short version: this was a useful first AutoTune run, and the data looks believable. I would apply this correction, then do another AutoTune ride.** I would *not* regard the tune as finished yet.

Dynojet describes AutoTune Basic as an iterative process: collect data, apply the VE corrections, then repeat under varied riding conditions. It uses the stock narrowband O₂ sensors and modifies the VE tables based on what it learns. ([Dynojet][1])

### The headline numbers

Your session shows:

* **51,016 samples**
* **31,223 accepted**
* **19,793 rejected**
* **61.2% acceptance**
* **30.5% overall coverage — 162/532 cells**
* **10.9% average error**
* Front: **14,774 hits**, data in 95/315 cells
* Rear: **30,259 hits**, data in 105/315 cells
* Minimum hit count is **5**

The 30.5% coverage might initially look poor, but **I wouldn't be concerned about that at all**.

You don't actually ride in 100% of that table. There are combinations such as 3% throttle at 5,500 RPM or 30% throttle at 700 RPM that either rarely occur or aren't useful operating conditions. What matters much more is coverage through the cells the engine genuinely spends time in.

And there, you've done quite well.

## Your strongest area is exactly where I'd want it

Look at the rear-cylinder hit-count table.

There's a huge concentration around:

**2,000–3,000 RPM / 7.5–20% throttle.**

For example:

|  RPM | 7.5% |      10% |      15% | 20% |
| ---: | ---: | -------: | -------: | --: |
| 2000 |  207 |     1508 |      281 |  47 |
| 2250 |  177 | **4257** | **2430** | 250 |
| 2500 |  140 | **3568** | **3992** | 358 |
| 2750 |   32 | **1164** | **1639** | 266 |
| 3000 |    2 |      475 |      799 | 186 |

That's excellent real-world data.

It's basically screaming:

> **"This is where Paul actually rides his Low Rider."**

Which is precisely what we want AutoTune to learn well.

The front table shows essentially the same shape, albeit with fewer accepted hits.

### And you did get some higher-load data

You've also populated 20–30% throttle quite nicely between roughly 2,000 and 4,500 RPM.

For example, rear cylinder:

* 3000 / 30%: **229 hits**
* 3500 / 30%: **116**
* 4000 / 30%: **74**
* 4500 / 30%: **57**

So you weren't just cruising around at 10% throttle.

That's good.

---

# The interesting bit: your % Error tables

This is where the ride becomes particularly useful.

There is a very obvious pattern in **both cylinders**.

At low RPM/load, you're seeing substantial **negative corrections**.

Then around 2,200 RPM the corrections cross through zero.

Then through the main midrange they're predominantly **positive**.

For example, rear cylinder:

**2000 RPM**

10%: **−9.7%**
15%: **−6.5%**
20%: **−8.0%**

Then:

**2250 RPM**

10%: +2.2%
15%: +6.5%
20%: +5.4%

**2500 RPM**

10%: +7.2%
15%: **+11.6%**
20%: +9.6%

**3000 RPM**

10%: **+12.7%**
15%: **+13.4%**
20%: **+11.1%**

**3500 RPM**

10%: +10.9%
15%: +13.2%
20%: +11.4%

The front cylinder tells essentially the same story.

At 2500:

10% **+10.7%**
15% **+14.7%**
20% **+11.7%**

At 3000:

10% **+10.1%**
15% **+13.4%**
20% **+12.9%**

That's important because it isn't a couple of random cells.

You've got **hundreds or thousands of observations in those areas**, and both cylinders independently show broadly the same trend.

So I believe the correction.

Your starting tune appears to be **meaningfully off in the midrange VE area**, rather than us just looking at noisy AutoTune data.

---

# Look at what AutoTune wants to do to the actual VE numbers

This becomes really obvious comparing Actual against Average.

Rear, 3000 RPM / 15%:

**Actual VE = 107.0**
**Average learned VE = 92.6**

That's roughly that +13% correction shown on the error screen, depending on the direction/convention Dynojet uses when displaying error versus VE correction.

Likewise there are substantial differences around 2500–3500.

The front cylinder has the same broad region needing correction.

That tells me something else:

### Your base map isn't terrible.

If it were completely inappropriate for the bike, I'd expect chaotic corrections everywhere and lots of cells hitting whatever correction limit you've configured.

Instead you've got a **coherent ridge of correction** through a particular operating region.

That's exactly the sort of thing AutoTune is intended to clean up.

---

# What about those ugly −20 to −26% cells?

This caught my eye immediately.

For instance, rear:

850 / 3%: **−26%**

1000 / 3%: −24.8%

1125 / 10%: −24.5%

2250 / 4%: −26.1%

Front has similar low-RPM anomalies.

I **would not chase those cells manually**.

Some are associated with idle, throttle transitions, overrun, very low MAP, etc. Narrowband AutoTune gets much less useful information around transient operating conditions.

More importantly, the PV4 has filtering when you apply the correction. Dynojet specifically provides **Detection Sensitivity** and **Smoothing Strength** during Apply Correction so anomalous cells can be identified/smoothed relative to surrounding cells. ([Dynojet][2])

So don't look at −26% in one low-load cell and think:

> "Christ, something's wrong with the engine."

I don't see evidence of that here.

---

# Front vs rear

There's a noticeable difference in the number of accepted samples:

**Front: 14,774**
**Rear: 30,259**

That's worth keeping an eye on.

But the important thing is that the **shape of the corrections broadly agrees between the cylinders**.

For example around 2500–3500 / 10–20%, both cylinders want significant corrections in the same direction.

If one cylinder were saying +13% and the other −15% in heavily sampled cells, I'd be considerably more suspicious.

That's not what you're showing me.

---

# Your 121–122°C engine temperature

That's hot, but not surprising for an air/oil-cooled Milwaukee-Eight after an AutoTune ride, particularly if you've deliberately spent time loading different cells.

And it reinforces something for the next run:

**Don't sit stationary trying to fill cells.**

Keep the motorcycle moving and let airflow do its thing.

Dynojet themselves point out that AutoTune Basic temporarily extends closed-loop operation into areas where the bike normally wouldn't operate closed-loop, and specifically note that doing this at high load/high RPM isn't ideal; wideband AutoTune Pro is preferable for extensive tuning in those regions. ([Dynojet][3])

---

# Would I press Apply?

### Yes.

If this were my 107 Low Rider, **I'd apply this session.**

Dynojet's documented process is exactly that: Apply Correction → review/filter the correction → Accept Correction; the PV4 then creates the corrected tune, keeps AutoTune enabled and flashes it back into the ECU so another learning iteration can be performed. ([Dynojet][2])

I wouldn't reset this session and try to collect 60% coverage first. You've already accumulated **31,000 accepted samples**, including thousands in the motorcycle's important cruising/midrange cells.

There's useful information here.

### Then I'd ride it again.

And here's where I'd change what you do on **AutoTune Run #2**.

Don't deliberately reproduce exactly the same ride.

You've already absolutely hammered:

**2250–2750 RPM / 10–15% throttle.**

You don't need another 4,000 samples there.

Instead I'd deliberately spend more time around:

**1500–2000 RPM / 5–20%** — normal gentle acceleration, not lugging.

**2750–3500 RPM / 20–30%** — moderate roll-ons.

**3500–4500 RPM / 15–30%** — use a lower gear and hold steady throttle/load where safe.

And I'd include normal **town riding, open-road cruising, hills, and progressive acceleration**. That's consistent with Dynojet's recommendation to gather varied city, highway, acceleration and incline/load conditions. ([Dynojet][1])

Don't try to fill every red box like it's a game of Tetris.

---

## What I really want to see after Run #2

This is the important test.

After applying this correction, the next run's errors in your heavily populated **2250–3500 / 10–20% region should shrink considerably**.

Right now you're seeing lots of:

**+10, +12, +14%**

If the process is converging properly, the second iteration should start showing much more:

**+2, −1, +4, −3%**

in those same well-sampled areas.

Dynojet's default AutoTune Basic setup actually uses **5% target error**, which gives us a useful benchmark. ([Dynojet][4])

So I'm much more interested in seeing your **Average Error drop from 10.9%** on the next iteration than I am in seeing coverage rise from 30.5% to some enormous number.

If Run #2 drops to, say, **5–7% average error**, and Run #3 gets the important riding cells mostly within roughly ±5%, I'd say we're watching a healthy tune converge.

One other thing: **before you press Accept Correction, screenshot the "Review Correction" screen that appears after you press Apply.** That's arguably even more useful for me than these screens because I can see exactly what PV4 intends to write into the VE tables after its filtering. ([Dynojet][2])

So: **Apply → don't Accept yet → send me that screen.** Then we can inspect exactly what it's proposing before you flash it.

[1]: https://www.dynojet.com/blog/autotune-on-power-vision-4-full-in-depth-guide/?utm_source=chatgpt.com "Autotune on Power Vision 4 | Full In-Depth Guide | Dynojet"
[2]: https://www.dynojet.com/amfile/file/download/file/11792/product/265858/?utm_source=chatgpt.com "98100027.03 Power Vision 4 User Guide"
[3]: https://www.dynojet.com/blog/autotune-a-product-and-a-process/?utm_source=chatgpt.com "Autotune - a Product and a Process | Dynojet"
[4]: https://www.dynojet.com/amfile/file/download/file/11792/product/249740/?utm_source=chatgpt.com "98100027.03 Power Vision 4 User Guide"
You
After ride number one, we ended my auto tune session and applied the tune to the bike.

Do I need to concentrate on low RPMs and above 3 and a half thousand RPM. Can you remind me, is that what I need to look at specifically in ride number two
ChatGPT
Yeah, that's it. Focus on filling in the edges of your riding a bit more. So that means some 1500 to 2000 RPM gentle acceleration. Then moderate roll-ons through 2750 to 3500. And then spend some time in the 3500 to 4500 range at moderate throttle. You could use lower gears there so you're not speeding. You don't need to hammer 2250 to 2750 at10 to 15% throttle again. Yesterday's ride was great for that. Just a varied ride that adds those other zones. Say 30 to 45 minutes.
You
Ok, I've been on ride number 2, and concentrated on keeping revs low, or above 3500 Here are 9 screenshots
ChatGPT
Yes — and **Ride #2 is a big improvement**. The most important number is exactly what we hoped would happen:

**Ride #1 average error: 10.9% → Ride #2: 4.4%.**

That is strong evidence that applying the first AutoTune corrections moved the VE tables substantially closer to what the bike is actually asking for.

### Ride #1 vs Ride #2

|                       |           Ride #1 |               Ride #2 |
| --------------------- | ----------------: | --------------------: |
| Coverage              | 30.5% / 162 cells | **34.0% / 181 cells** |
| Average error         |         **10.9%** |              **4.4%** |
| Total samples         |            51,016 |                49,134 |
| Accepted              |            31,223 |                23,762 |
| Acceptance            |             61.2% |                 48.4% |
| Front cells with data |                95 |               **106** |
| Rear cells with data  |               105 |               **107** |

The lower acceptance rate doesn't particularly bother me here. You deliberately changed how you rode, including more transitions and unusual RPM/load combinations, and you still got nearly **24,000 accepted samples**.

What matters much more is what happened to the errors.

## The area that worried us yesterday has basically converged

Remember Ride #1 around **2500–3500 RPM / 10–20% TPS**?

We had corrections such as +10%, +12%, +14%.

Look at the rear cylinder now:

**2500:** −1.7, −1.7, +0.8
**2750:** −0.4, +0.5, +3.1
**3000:** +1.8, +0.2, +2.3
**3500:** +10.3 at 10%, but then +2.3 and +0.6 at 15/20%.

And the front:

**2500:** −1.4, −0.5, −0.1
**2750:** −0.8, +0.3, +0.9
**3000:** +2.8, 0.0, −0.5
**3500:** −2.3, −1.1, +0.3.

That's **really nice convergence**.

And these aren't cells with five samples. Your hit-count screens show hundreds or even **1,500+ hits** in many of them.

For example around 3500 RPM you've now got approximately:

* Front 15%: **1534 hits**
* Rear 15%: **1536 hits**
* Front 20%: **185**
* Rear 20%: **203**
* Front 30%: **156**
* Rear 30%: **167**
* Front 40%: **223**
* Rear 40%: **219**

So the second ride did exactly what we wanted.

## You also nailed the >3500 RPM exercise

This is probably the best part of Ride #2.

Yesterday your higher-RPM coverage was relatively thin. Now you've put a lot of useful samples into:

**3500–4500 RPM / 10–40% throttle.**

And look at the errors through most of that region.

At 4000 RPM, rear:

15% **+4.9**
20% **+0.6**
25% **−0.4**
30% **+0.1**

Front:

15% **+2.3**
20% **+1.8**
25% **+0.5**
30% **+0.6**

That's excellent.

Likewise 4500 RPM is generally around +3–5% or less once you're above the very-low-throttle cells.

So I **wouldn't deliberately hammer the 3500–4500 region on the next ride**. You've got what we wanted from it.

---

# And your low-RPM exercise worked too

You've dramatically increased useful coverage around **1500–2000 RPM**.

For example, around 1500 you've got ~550–600 hits at 5–10% throttle on both cylinders.

At 1750 you've got roughly:

7.5%: ~750
10%: ~900

At 2000:

7.5%: ~700
10%: ~1150.

That's heaps of data.

And importantly, much of that region is now within a few percent.

There are still some nasty-looking isolated cells — −15%, −20%, etc. — particularly around very low TPS.

But again, **don't chase those individually**.

---

# One area I want to watch

There's an interesting island around roughly:

**1750–2000 RPM / 20–25% throttle.**

Front shows:

1750/20: **+16.3%**
1750/25: **+16.8%**

Rear:

1750/20: +9.5%
1750/25: +9.4%

At 2000 the front is also around +9–10% through 15–20%, while the rear is much closer in some of those cells.

However, look at the hit counts: some of those cells only have **7–30 samples**.

Compare that with a cell having 1,500 samples and I'm going to trust the 1,500-sample cell considerably more.

I wouldn't deliberately lug your 107 at 1750 RPM and 25% throttle just to populate those boxes. That's not worth abusing the engine for a pretty green table.

---

# There is one thing I DON'T like

Your screenshot shows:

**ET: 135°C.**

Yesterday you were around 120–122°C.

That's pretty bloody hot.

I wouldn't deliberately continue an AutoTune exercise at that temperature just to collect more cells. The whole point is to tune the motorcycle under representative operating conditions, not heat-soak it trying to complete a table.

If you're deliberately running low gears at 3500–4500 to generate load/RPM, make sure there's decent airflow. And if you're doing repeated low-speed work, break it up with normal open-road riding.

---

# Should you APPLY Ride #2?

**Yes, I would.**

This one gives me *more* confidence than Ride #1.

Ride #1 was effectively the big coarse correction.

Ride #2 is now doing much smaller cleanup corrections across the important operating area.

That **10.9% → 4.4%** change is exactly the convergence we wanted to see.

So I'd:

**Apply Ride #2 → flash the corrected tune → start a fresh AutoTune session for Ride #3.**

But Ride #3 should be different again.

### Don't deliberately target cells this time.

For Ride #3, I'd simply **ride the Low Rider normally**.

Town traffic.
80–100 km/h roads.
Some hills.
Normal overtaking/roll-ons.
A few spirited accelerations where appropriate.
Use the gears exactly as you ordinarily would.

Maybe **30–45 minutes**.

Why?

We've now taught it the main cruise region on Ride #1 and deliberately broadened the RPM/load range on Ride #2. Ride #3 should answer a different question:

> **Does the corrected tune stay close when Paul simply rides the motorcycle like Paul normally rides the motorcycle?**

That's far more valuable now than trying to turn every box green.

And I would use Ride #3 as our **convergence/validation run**. If the heavily sampled cells remain mostly within roughly ±5%, and the overall average stays around 4–5% or drops further, I'd be getting very reluctant to keep applying endless corrections just for the sake of AutoTuning.

There is one other really encouraging detail here: **front and rear hit counts are now almost identical — 21,591 vs 22,040.** Yesterday there was a huge imbalance (14,774 vs 30,259). Whatever produced that discrepancy on Ride #1 isn't happening now.

So yes: **apply #2, then #3 = forget about the table and just go enjoy the bloody Harley.** 😄
You
I'm not worried about the high temp, I was riding in 3rd gear doing 130kph so I could collect high rpm data, of course I'm going to get hot
ChatGPT
Yep — with that context, **135°C makes sense**, and I wouldn't treat it as a warning sign from the AutoTune data itself.

Holding the M8 at high RPM in 3rd specifically to populate the **3500–5000 RPM cells** is very different from seeing 135°C while casually cruising. You're deliberately running substantially more RPM than you normally would at that road speed, so you're generating more heat despite having plenty of airflow.

And it worked: your Ride #2 hit tables show **much better coverage from 3500 through 4500 RPM**, including useful samples at 15–40% TPS. That's exactly the area we were trying to improve.

For Ride #3, I wouldn't repeat the 130 km/h-in-third exercise. You've already collected good data there. After applying #2, I'd make #3 predominantly **normal riding**, with perhaps a handful of ordinary roll-ons through 3000–4500 rather than deliberately holding it there.

The really satisfying result remains **10.9% average error → 4.4% after one correction cycle**. That's a much stronger indicator of how well this is progressing than trying to maximize the percentage of table coverage.
This is becoming a very technical excuse to go riding
First there were handlebars to test.
Then there was a pillion adventure.
Then there was suspension to sort out.
Now there’s engine data to collect.
I’m beginning to suspect that “I need to take the Harley out for another test ride” might be the most useful sentence I’ve learned this year.
It sounds responsible.
It sounds methodical.
It sounds considerably better than:
“I would like to disappear on my motorcycle again.”
And the best part is that there really is something to test.
The first ride identified useful corrections. The second showed encouraging progress after applying them.
So yes, the title contains unnecessary grunting.
But underneath that, there’s a fairly satisfying little engineering project happening.
The Low Rider is getting more personal, one modification and one ride at a time.
And apparently I’ve reached the stage where even my unnecessarily loud motorcycle comes with supporting documentation.

0 Comments